Last week the S&P 500 had a positive week for the first time this year. The first two weeks were down significantly. Investors are concerned with the following issues:
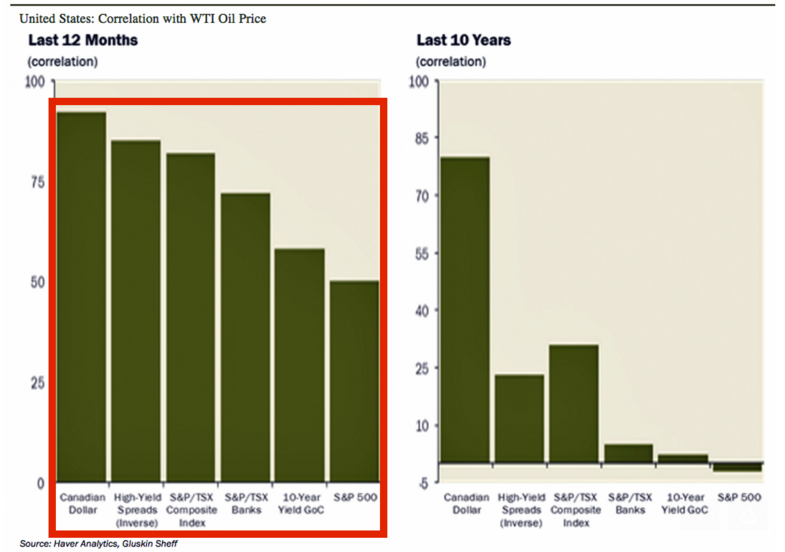
Of all these issues the price of oil seems to be the biggest driver of the investment markets right now. In fact the correlation of oil price moves to investment market moves has risen to all-time highs. See the chart below highlighting this effect. The chart on the left shows correlations to oil during the last 12 months and the chart on the right shows correlations the last 10 years:

What’s interesting is that U.S. stocks used to be negatively correlated to oil where now they are highly correlated to oil. And High Yield has moved from a small correlation to over an 80% correlation to oil price movements. Lower oil prices used to be considered a good thing for the economy, but not so much today, why?
Because of this, the decline in oil from $37 to $27 the first two weeks of January led to stocks declining sharply, and the subsequent recovery in oil this past week from $27 to $32 led to a nice rebound in stocks. It appears for the time being oil prices will be at the forefront of investor sentiment and we’ll be watching it closely.
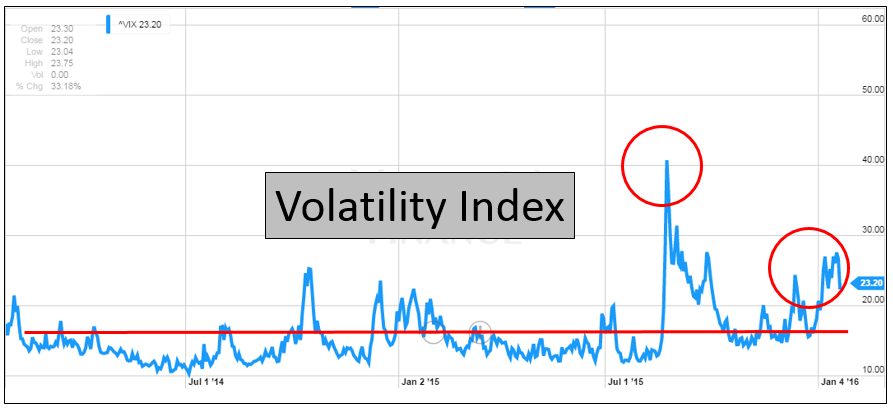
As oil price movements become more volatile, we’d expect the stock market to become more volatile. This has been the case as the VIX chart below illustrates:

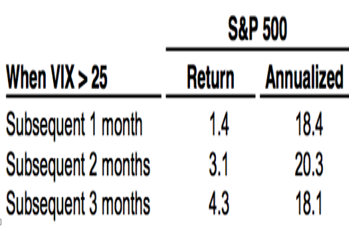
The VIX is an indicator of market volatility and we can see that recently volatility has increased (red circles) above relatively lower levels of volatility (red line) we’ve experienced the last 2 years. One thing to keep in mind:

We are keeping a close eye on both the stock and oil markets. Market volatility has picked up, but we still believe our forecast of positive mid-single- digit returns is achievable.
