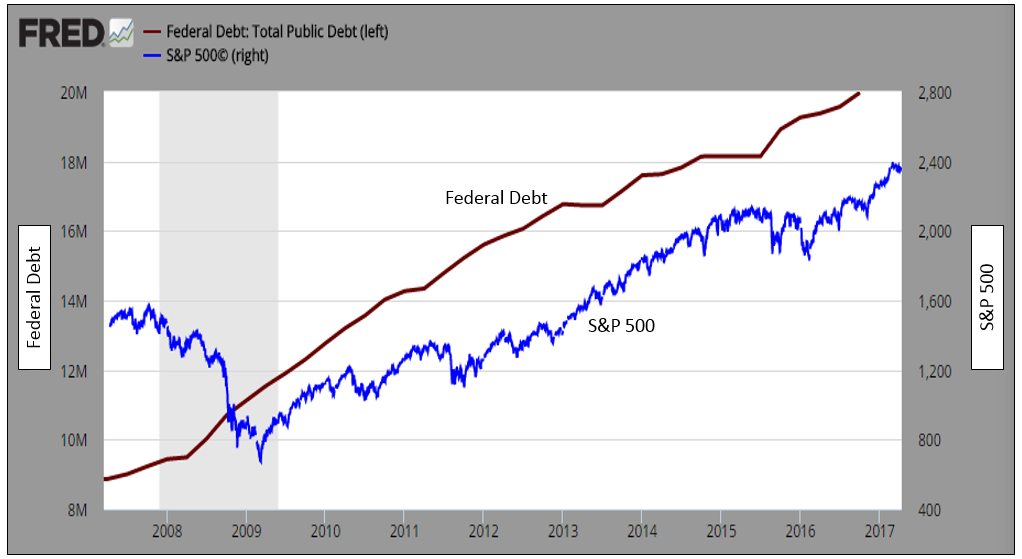
Since the lows of 2009, the U.S. stock market (S&P 500) has tripled as the economy and corporate profits have recovered. The federal debt levels of the U.S. government have almost doubled in the same time period. Federal debt outstanding has moved from roughly $10 trillion at the depth of the financial crisis to almost $20 trillion today.
See the chart below illustrating the moves in both the stock market and the federal debt:
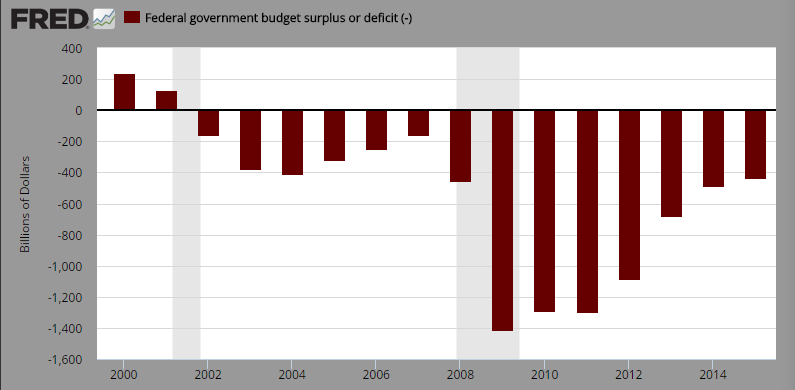
Federal debt increases are the subject of immense media sensationalism, political grandstanding, and investor anxiety. How did the debt increase so much? It’s largely in response to the imploding economy during the financial crisis of 2008-2009. Debt increases are a function of the government not being able to pay its bills. Too little revenue (taxes) compared to costs (spending) equals budget deficits. Ever since 2001 the federal government has been running annual deficits, in fact they rarely show a surplus. See the chart below illustrating annual surpluses and deficits:
As an investor, should I be concerned about the ever increasing levels of debt at the federal level? The answer is really yes and no. We certainly don’t want to see federal debt doubling every 8 years, but I would focus less on the actual debt number and more on the our government’s ability to service (pay the interest) on its debt. When we look at our ability to service the debt, a less alarming picture presents itself. There are a couple of things to take into consideration when discussing debt service.
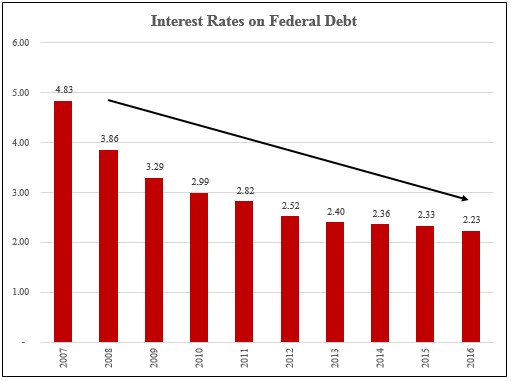
First, what is the interest rate our government is paying on its outstanding debt? Before the financial crisis, rates on federal debt was close to 5%. Today it’s down, closer to 2%. When rates are lower, the government can carry more debt and keep debt servicing amounts level. See the chart below:
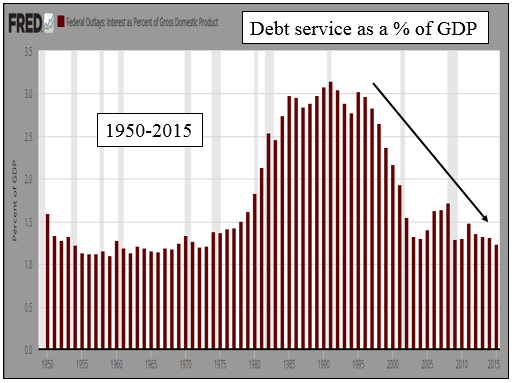
Secondly, I think it’s worthwhile to look at government debt interest payments as a percentage of our economy (GDP). Federal debt servicing costs as a percentage of GDP are at normalized historical levels. In fact, debt service was at much more alarming levels in the 1980’s and 1990’s when interest rates were much higher and defense spending was being ramped up, as seen in the chart below:
A few other things to consider on the topic:
- The entirety of the $20 trillion obligation never really comes due, it’s simply rolled over (much as corporate America does).
- If the global investing collective was concerned about the ability of the U.S. government to service its debt, I’d expect U.S. interest rates to skyrocket and the U.S. dollar to become very weak. Currently the exact opposite is occurring.
- Federal income tax revenue has also increased as our economy has grown over the years, offsetting increased debt obligations.
We know the media and politicians hype the absolute amount of Federal debt, but hopefully the last two charts on debt servicing levels puts your mind at ease on the matter. Remember, when we discuss federal debt we’re really talking about the full faith and credit of the U.S. government and its ability to pay and service its debt.
Currently investors and rating agencies around the world are comfortable with our ability to pay and service our federal debt. In fact, investors worldwide tend to feel U.S. government Treasury bills, notes, and bonds are a safe haven in the global fixed income marketplace.
To expand on these Market Reflections or to discuss any of our investment portfolios, please do not hesitate to reach out to us at 775-674-2222


