Are Inflation Alarm Bells Warranted?

The market is rallied on Monday after the Trump administration announced that the “trade war” with China is on hold. This is good news as investors were alarmed at the prospect of a global trade war. Now that the US and China have put additional tariffs on hold, the market may begin to focus on another metric to worry about, that’s inflation.

Inflation can hurt both consumers and corporations as it increases their costs. If inflation gets too high it tends to crimp economic growth, curtail consumer spending and raise input costs for businesses. None of these things would be looked at favorably by investors. The market hasn’t had to worry about inflation for quite some time, but recently several factors have emerged to raise inflation anxiety levels. They are:

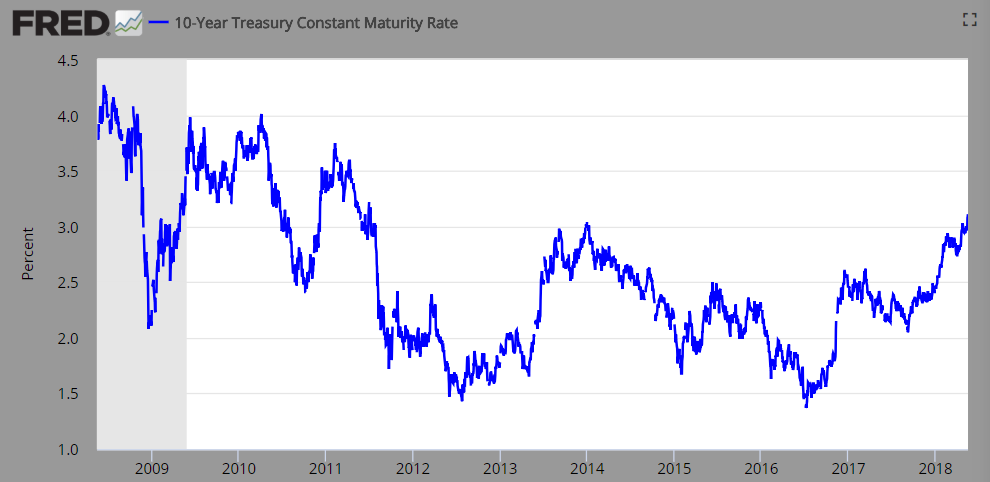
  • Interest rates are rising. The 10-year Treasury yield currently sits at 3.06%, a four year high
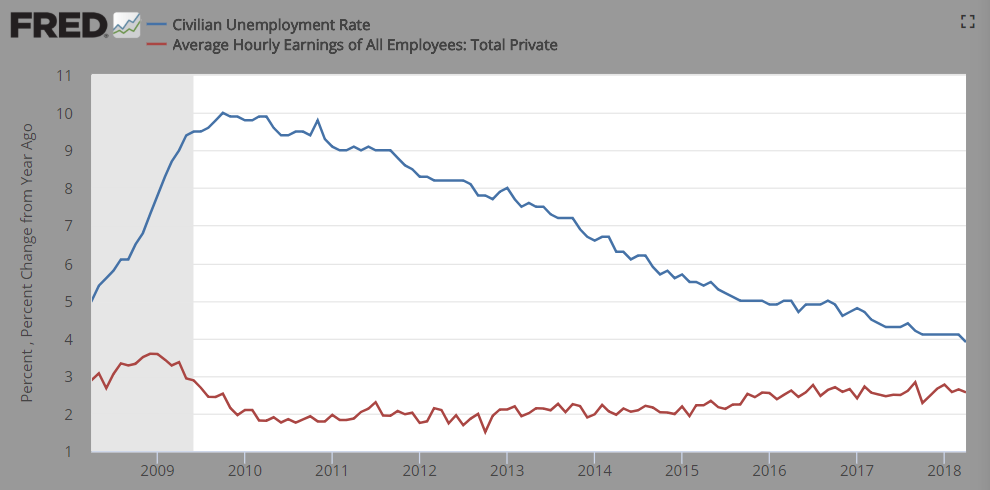
  • The unemployment rate has fallen below 4.0%, sparking fears of wage inflation
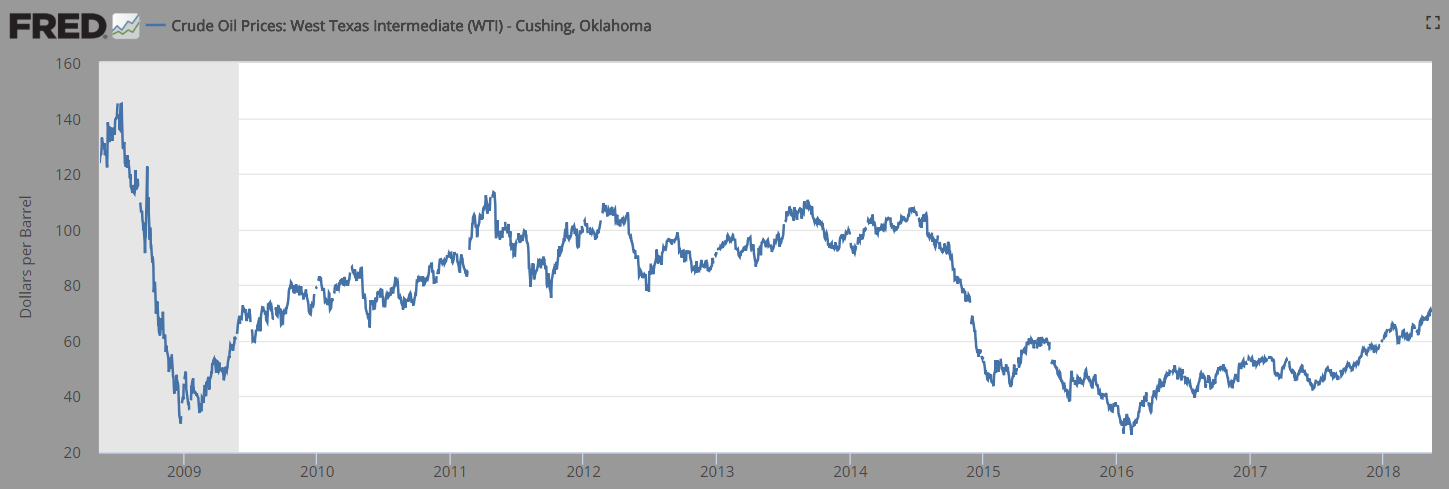
  • The price of oil has risen over the $70 per barrel level, raising concerns about energy costs

Let’s look at each in the charts below.

First look at the 10-year Treasury yield below as it’s moving towards post-recession highs:

Next, let’s examine the unemployment rate and wage inflation. The unemployment rate (blue line) is at ten year lows, while wage growth (red line) is gradually rising:

Finally, energy is a big cost for both businesses and individuals. The price of oil has rallied substantially lately to 3½ year highs, but still below the critical $100 per barrel level:

The combination of the above has led investors to become mindful of the risks higher inflation can have on the markets. But remember that the Federal Reserve believes that a certain level of inflation (roughly 2.5%) is good for a healthy economy. Inflation is measured by the Department of Labor in several different ways. The most common measures are:

  • The consumer price index (CPI) which measures the prices consumers pay for frequently purchased items
  • The personal consumption expenditures index (PCE) which measures a more comprehensive list of consumer items
  • The producer price index (PPI) which measures prices from a seller’s point of view

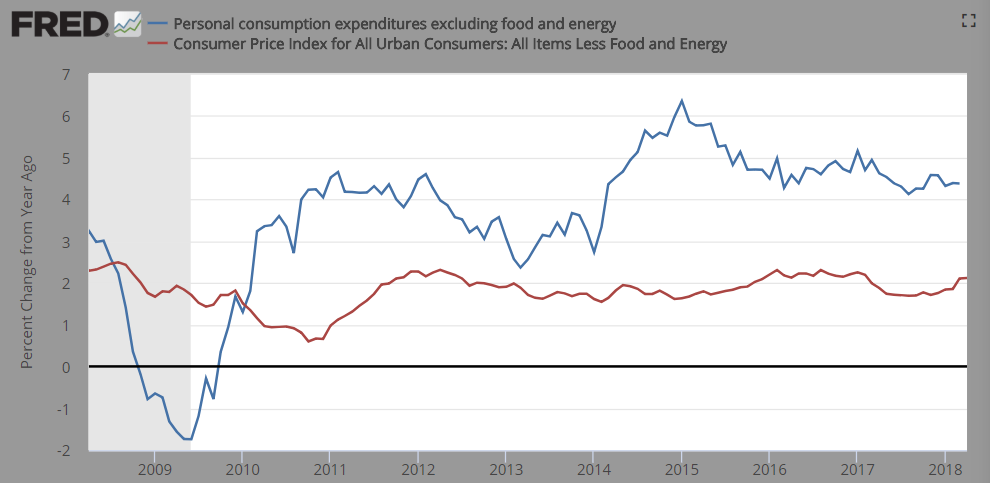
The PCE index is the preferred measure by the Fed as it analyzes inflation and makes interest rate decisions. It also prefers to use the “core PCE” index to analyze underlying inflation trends, which strips out food and energy components which tend to be very volatile. Investors watch both core CPI (red line) and core PCE (blue line) indices.

Looking at the chart above, both inflation readings are not yet at alarming levels. The core CPI (red line) index is above 2.0%, but still below the target of 2.5%. The core PCE index is relatively stable since coming off its highs in 2015.

In summary, inflation seems to be contained and within normal levels within an expanding economy. Recently, the tightening of the labor market, rising wages and increasing energy costs could potentially lead to future increases in inflation readings. These metrics bear close monitoring, and we’ll be watching to see if our stance on inflation needs to change.

To expand on these Market Reflections or to discuss any of our investment portfolios, please do not hesitate to reach out to us at 775-674-2222.
Posted on May 23, 2018 Read More

1st Quarter 2018 Economic Review and Market Outlook

Posted on May 14, 2018 Read More

Market Trades on Trade

April marked another month of heightened stock price volatility as investors tried to negotiate swiftly changing economic and political conditions. It feels like the market is on a high speed treadmill; it exerts maximum effort but remains stationary. The sideways price action with greater volatility has been a good education as investors are being reintroduced to market volatility without serious portfolio consequences. Daily fluctuations in the Dow Jones Industrial Average of 200-500 points became commonplace in April. On the heels of a calendar year which had just eight trading days with a price change of greater than one percent is an awakening. The stock market is on pace to produce 100 daily trading days of greater than one percent in 2018. Buckle up.

Global trade policies and tariff talk took center stage in April. President Trump called for further trade tariffs directed toward China, initially proposing $50 billion in tariffs on Chinese imports then doubling down by disclosing that the administration was considering a further $100 billion. President Xi of China responded in an economic speech opening the door to future discussions. Let the negotiations begin. With so much at stake, expect the world to find a workable middle ground as it relates to free and fair trade.

Beyond the front page trade and tariff headlines, there is a series of important economic stories that will dictate the market’s path for both stocks and bonds. Stocks will be very focused on this new set of quarterly corporate earnings releases. Expectations are high with earnings growth anticipated to be in the 15-20% range. This is an aggressive hurdle where earning shortfalls can punish prices. So far earnings have been very strong, but it appears the stock market already priced this good news into stocks back in the December and January timeframes and is now moving its sights forward to next quarter’s earnings.

Despite the wild ride to start 2018, the stock market offers better relative value today versus the end of January. Price earnings (PE) ratios have come back to earth with prices flat and earnings up. The S&P 500 now trades at 16.1x forward earnings as compared 18.0x at the end of 2017. A 16.1x PE ratio also happens to be the 25-year average, so current valuations are fair given the current environment. There is still some runway left for earnings to grow the remainder of this year and into 2019. At the end of the day, earnings and valuations will drive stock prices.

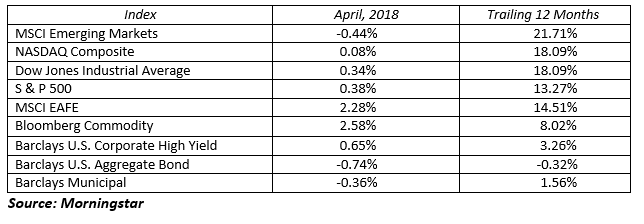
Stock markets were basically unchanged for the month, with the benchmark S&P 500 advancing 0.38%. The Dow Jones Industrial Average, NASDAQ 100 and the MSCI EAFE finished the month slightly positive while the MSCI Emerging Markets was slightly negative.

The Fed raised the benchmark fed funds rate by a quarter percentage point to the 1.50-1.75% range at their March meeting. The hot debate is whether there will be three or four rate hikes this year. April releases of modest inflation numbers and slower employment growth lead us to believe the final answer will be three Fed rate moves this year. Eyes will now turn to their two day meeting in mid-June.

In the bond market, there were offsetting penalties as interest rates rose and credit spreads declined leaving most indices marginally negative. For the month, the benchmark 10-Year U.S. Treasury yield increased 21 basis points to 2.91% after spending three trading days above the much feared 3.00% level. The yield curve continued to flatten as short-term interest rates moved up higher than long-term interest rates. The 2-Year Treasury rose by 22 basis points to end the month yielding 2.49%, while the 30-Year Treasury rose 14 basis points to yield 3.11%. Despite the slow start to the bond market, we expect bonds to claw their way back to even by year end as future income will offset early year price declines.

It is times like this where you need to trust your financial plan, keep your emotions in check and march onward. Expect market volatility to remain elevated as background noises intensify. The dark clouds affecting the market in the near term will eventually give way to strong corporate earnings and favorable valuations. Stay your course and remain confident.

MARKETS BY THE NUMBERS: 

To expand on these Market Commentaries or to discuss any of our investment portfolios, please do not hesitate to reach out to us at 775-674-2222

Posted on May 9, 2018 Read More
Call Us: (775) 674-2222